REGIME RESEARCH FOR TRADERS & QUANTS.
READ THE
MARKET.
SEE THE
SHIFT.
A stock never trades in isolation. Connect market direction, industry leadership and stock selection in one research workflow. Build your next US equity shortlist with a clear view of the conditions behind it.

THE MARKET.
IN FULL COLOR.
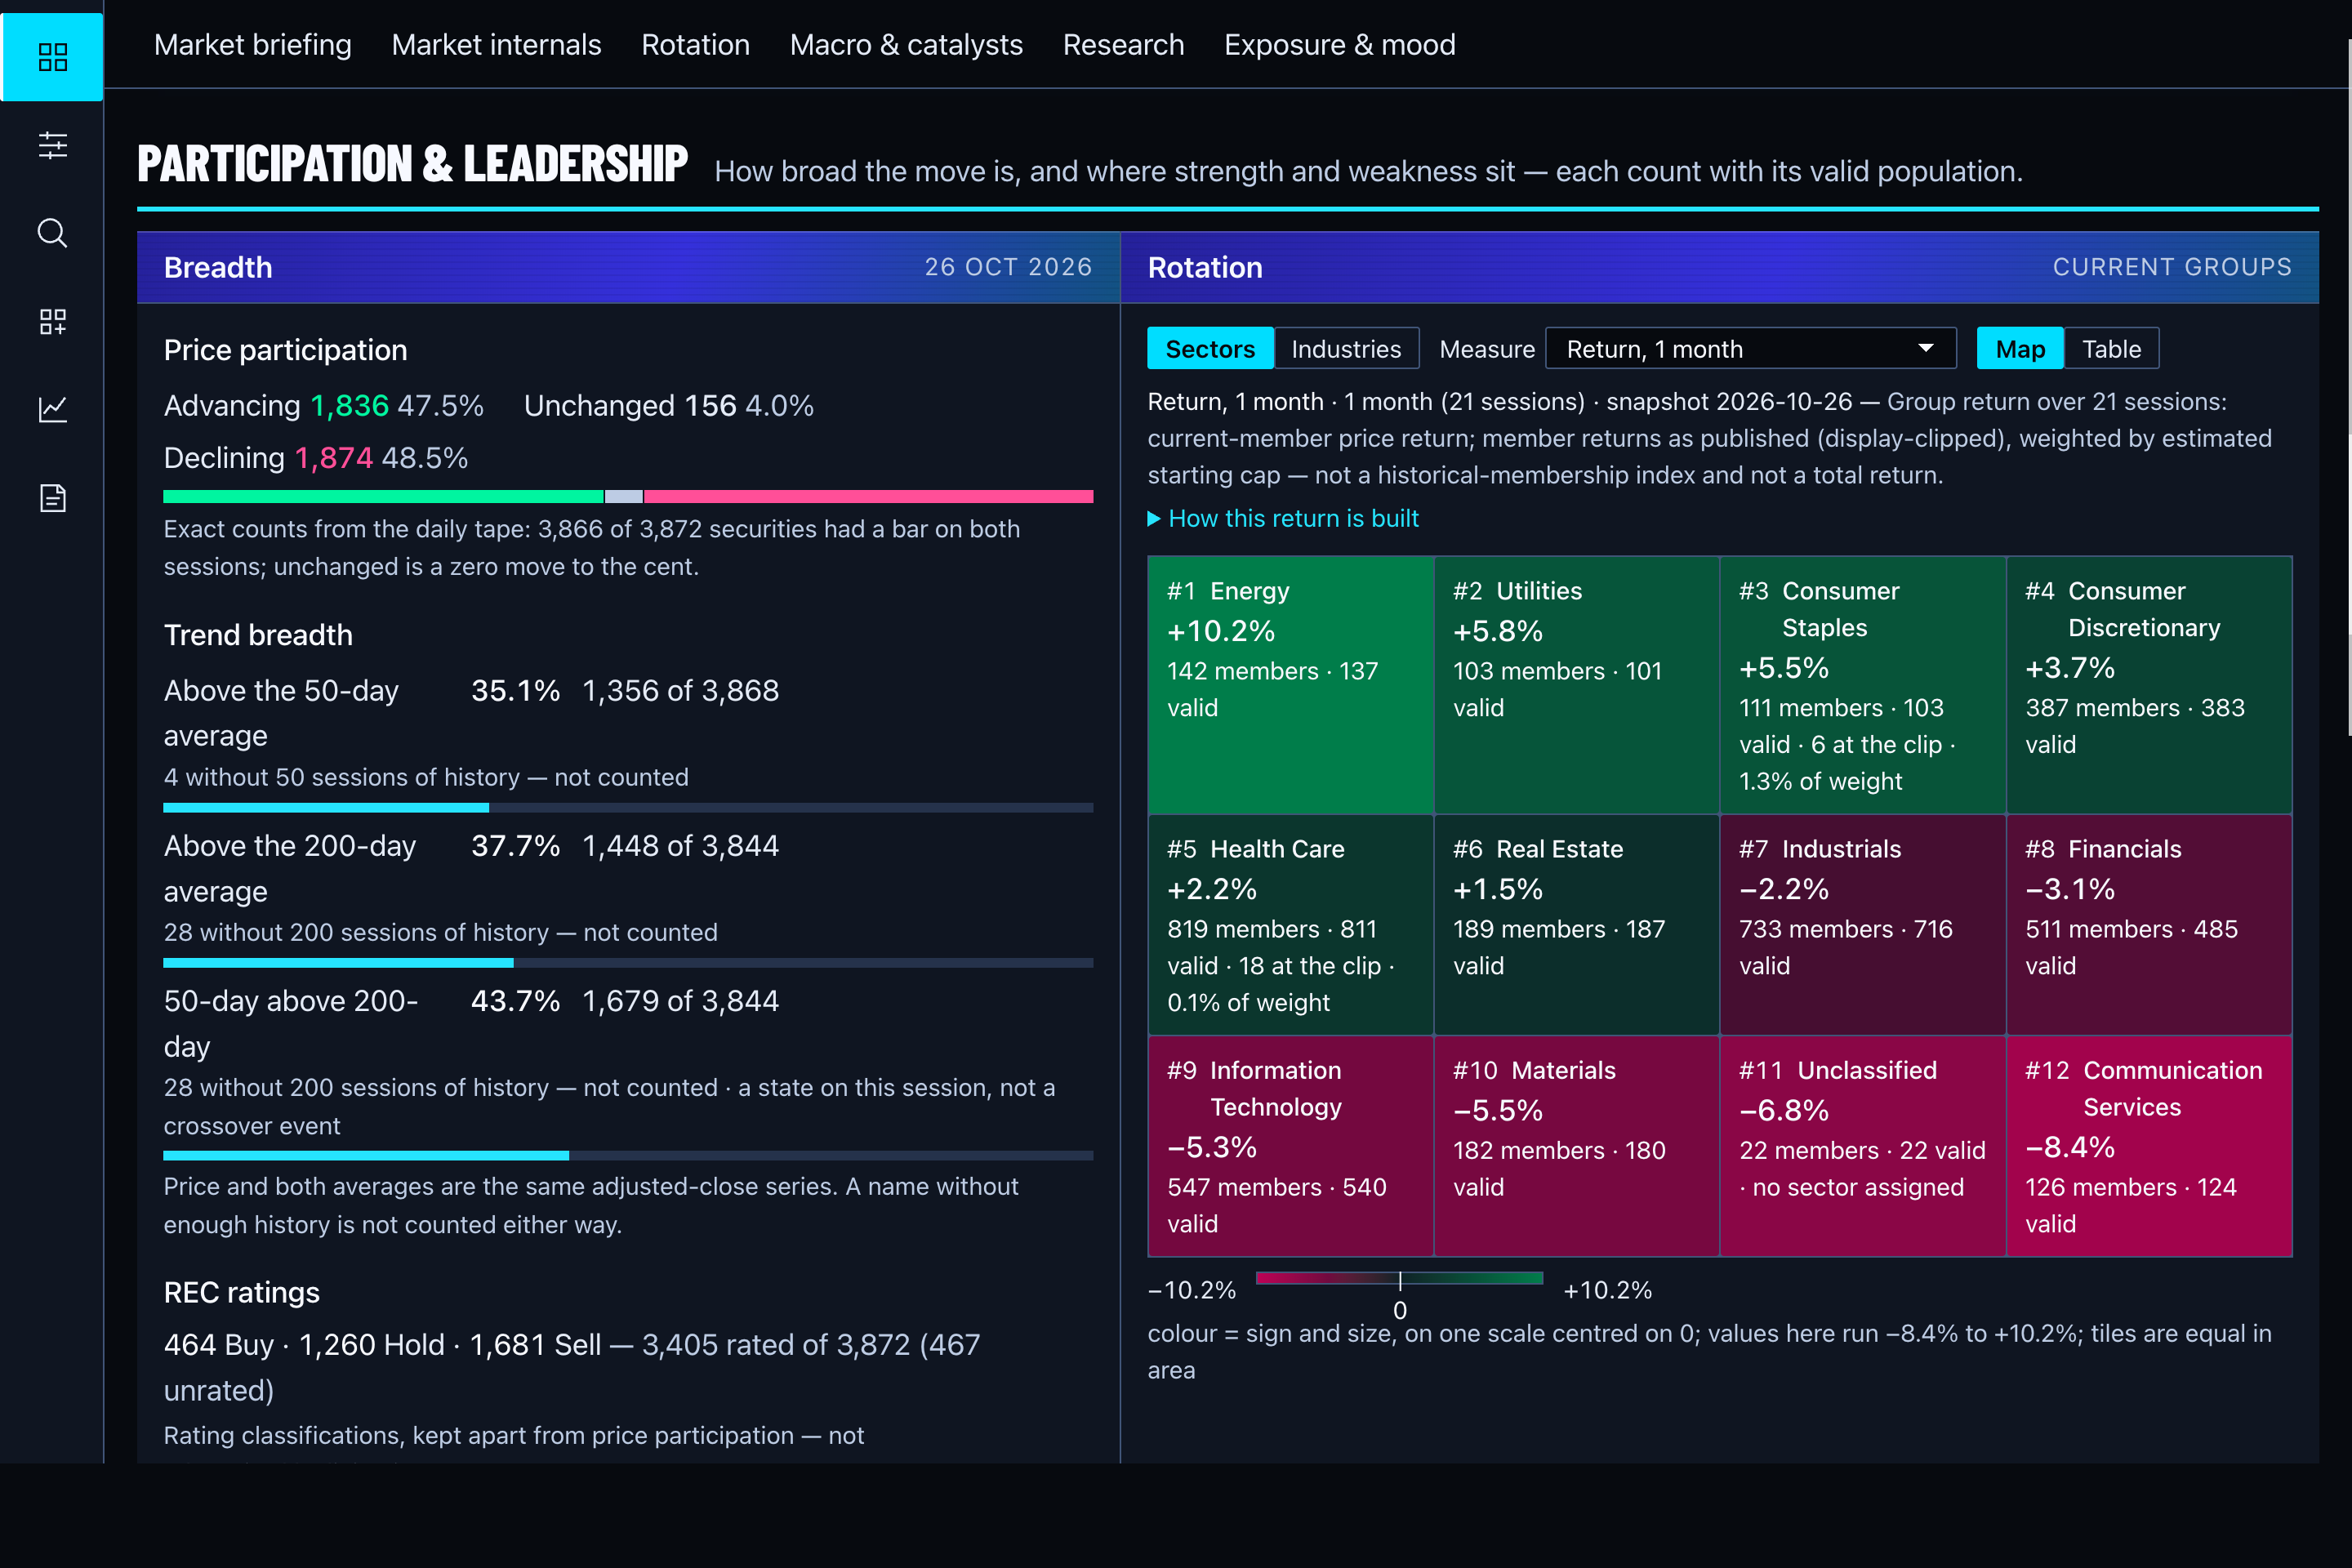
See participation beside sector leadership. Inspect the measures, dates and coverage behind the color. This is an actual terminal screenshot showing the 26 October 2026 session.
A WIDER VIEW.
A SHARPER READ.
Start with the market your strategy has to work in. Follow participation and sector leadership into the stocks behind the move. Shape a shortlist around your own research question, with the readings and dates in reach.
Read the market regime
Compare RA’s Market trend, Exposure and Mood readings. Set direction beside stress and breadth. See where the market’s readings agree and where they pull apart.
Follow sector leadership
Compare sectors and industries on shared scales. Explore their recorded history. Follow a group into the stocks behind its move.
Build your research shortlist
Turn your research question into screening conditions. Inspect the matching stocks and the measures behind them. Save your rules and dated results for the next review.
Take research into your tools
Bring selected RA readings into your own code and AI tools. Explore the documented responses and examples. Customer REST/MCP access is offered through a separate invited pilot.
BEYOND
THE HEADLINE.
Daily participation describes how many measured securities advanced in this session. Trend breadth shows how many measured securities closed above their own 50-session average. Read the two together to distinguish a day’s move from the broader trend, with each measure’s coverage kept visible.
- Advanced this session
- 36.7%1,419 of 3,869 measured securities
- Above their 50-session average
- 34.3%1,330 of 3,878 measured securities
Frozen sample from the published RA universe, not an index return or live feed. Missing values are excluded from each measure. Open the evidence for coverage, calculation and source publication.
ONE MARKET.
DIFFERENT
PERSPECTIVES.
A market can rise while stress builds. RA’s Market trend, Exposure and Mood measures separate direction, the engine’s target exposure and stress. Read them alongside breadth and sector leadership to investigate where the evidence agrees or diverges.
Explore the readings ↗- 01Market trend
- Read the published direction call and its recent path. Inspect the market trend measure behind it. Its threshold is a rule boundary, not a forecast.
- 02Exposure
- See the sizing engine’s published target. Trace that target to its stress reading. Keep it distinct from your own portfolio’s actual exposure.
- 03Mood
- Put current stress beside its own history. See the published band and percentile. Calm describes stress, not an expected market direction.
CLOSE THE DAY.
KEEP THE WHY.
Keep the question, selection rules and dated results behind every saved shortlist. Reopen a recorded analysis or run the same rules against the latest publication. Take the rows captured in your saved analysis and the fields permitted for your account into your own workflow as Markdown or JSON. Sign in to keep analyses and ticker lists across devices, or continue with browser-local records.
Save research in the screenerYOUR NEXT IDEA.
STARTS HERE.
Start with the public market sample. Choose Research for the full terminal and a place to keep your work. Developers can explore a separate invited API/MCP pilot.
Read the selected public market sample without signing in. A free account adds one synced ticker list and one saved analysis. Analyses saved without an account stay in that browser.
Create a free account ↗Connect market readings, sector and industry research, and stock screening in the full terminal. Keep your ticker lists and dated analyses synced across devices. Revisit your original research or run its rules against the latest publication.
Explore Research ↗Read selected public observations with an API specification and runnable examples. Dates, definitions and missing values stay attached to each response. Customer API/MCP access is a separate invited pilot.
Explore developer access ↗A LITTLE
MORE CONTEXT.
Who runs Regime Analytics?
Erika Barker, a quantitative research engineer and data scientist in Miami Beach, builds Regime Analytics. She has worked with financial markets since 2005 and has extensive private-equity experience. Mercedes & McRill LLC operates the service; the About page explains the background, methods and financial interests.
Who is Regime Analytics built for?
RA is built for experienced US equity traders, quants and independent analysts who want to connect stock research with the market around it. Use daily publications for a repeatable review of market conditions, group leadership and your shortlist. Work in the terminal, or explore selected analytical outputs through the separate invited API/MCP pilot.
What does RA add to my existing research tools?
RA connects its own Market trend, Exposure and Mood readings with breadth, sector leadership and stock screening. Follow a research question from market context into groups and individual names, with the supporting measures in view. A saved analysis keeps your question, rules and recorded results together for the next review.
How does saved research work?
A new analysis receipt captures your question, notes, selection rules, publication metadata and every matched row in the chosen view. Save it to your account or browser, or download a Markdown or JSON receipt with its captured rows and the fields permitted for your account. Open Recorded values to review the retained rows and permitted fields, or refresh the rules to create a separate result from current data. Storage limits and any export field omissions are identified, and older saved samples remain labelled as samples. These records do not represent a synced portfolio or a complete historical universe.
How does Research membership work?
Research costs $39 USD per month and includes full terminal data plus further synced ticker lists and saved analyses. Checkout shows the final total and renewal terms before you pay, and Manage billing handles cancellation. Your saved work stays readable after a membership ends. Customer API/MCP access requires a separate invitation.
What can I explore today?
Use an entitled terminal account for a dated market briefing, breadth and sector leadership. Inspect group history and published research screens, then save your review in your browser or account. The Market Pulse on this page is a frozen sample, with its calculation evidence and observation date attached.
Open the terminal ↗Can I read the newsletter without an account?
Read the RA Market Brief without creating a terminal account. Choose the newsletter separately and confirm your email before joining its mailing list. You can unsubscribe independently of your account or billing settings.
Choose the newsletter ↗How do I get help or report a data error?
Email support@regimeanalytics.com with the publication date, ticker and field you were reviewing. The link below opens a draft with those prompts in your own email app, and nothing is sent until you choose to send it. Account, billing and privacy questions use the same address, as described in the privacy policy.
Draft a support email ↗Is this a real-time market feed?
Regime Analytics uses published daily observations. The dashboard shows publication dates so you can place each reading in time. It is not an intraday quote service.